Higher Education Reporting Made Simple
Evisions Argos delivers the insights that you need in order to make timely, better-informed decisions. Argos helps colleges and universities work better, delivering flexible, powerful, easy-to-use reporting tools developed by higher education experts.

Take Control Over Your Data
Empowers Timely Decisions
Unlimited Users
In the Hands of Users
Enable Your Team
Reports at Your Convenience
Frees Up IT
Boost Institutional Insights
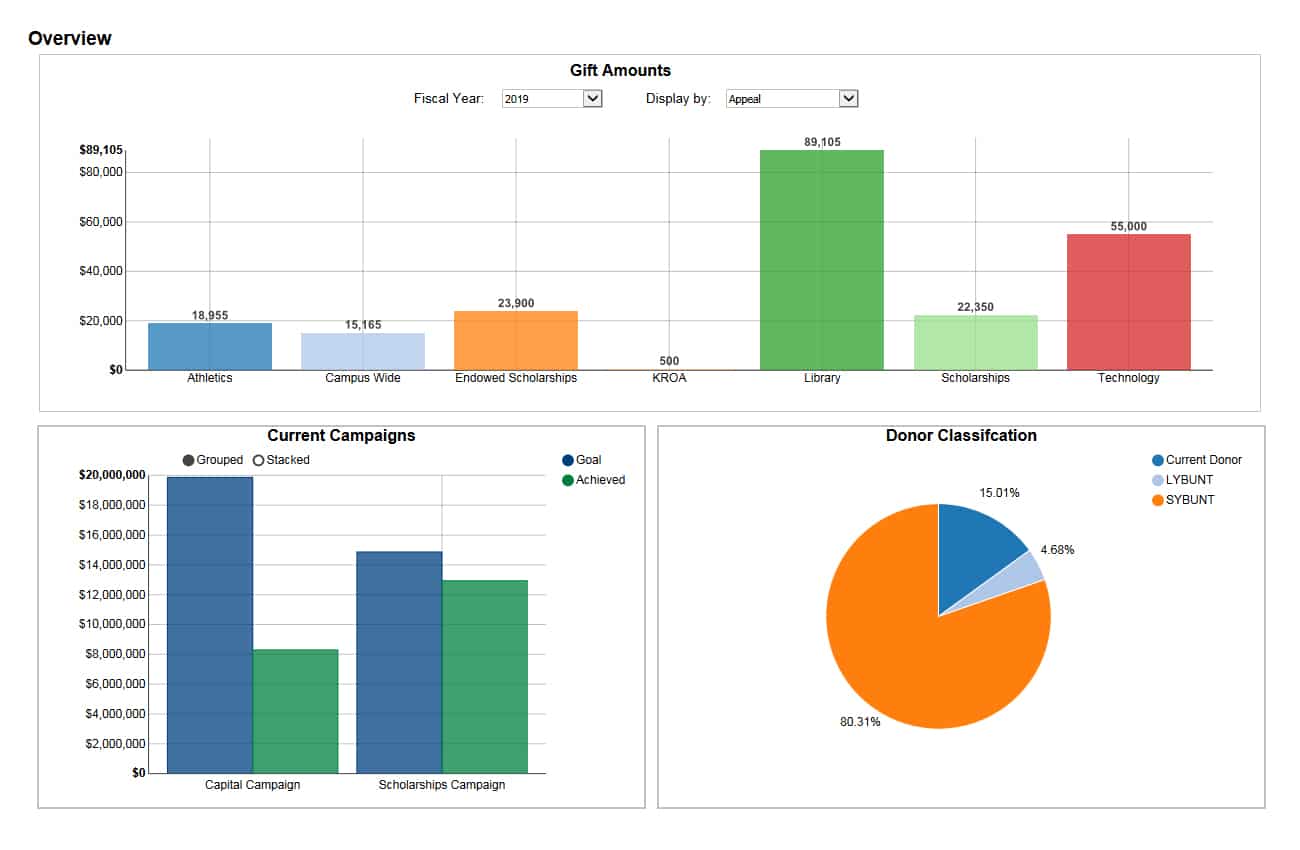
View student, departmental and institutional data in real time. Interactive reports and dashboards illustrate that data, providing insights at a glance and improving visibility throughout your institution. You can also: Schedule reports and emails; Use the Data Dictionary and Library of Objects; Insert, update, and delete!
Read about all the key features and capabilities Argos has to offer.
Expand Your Resources
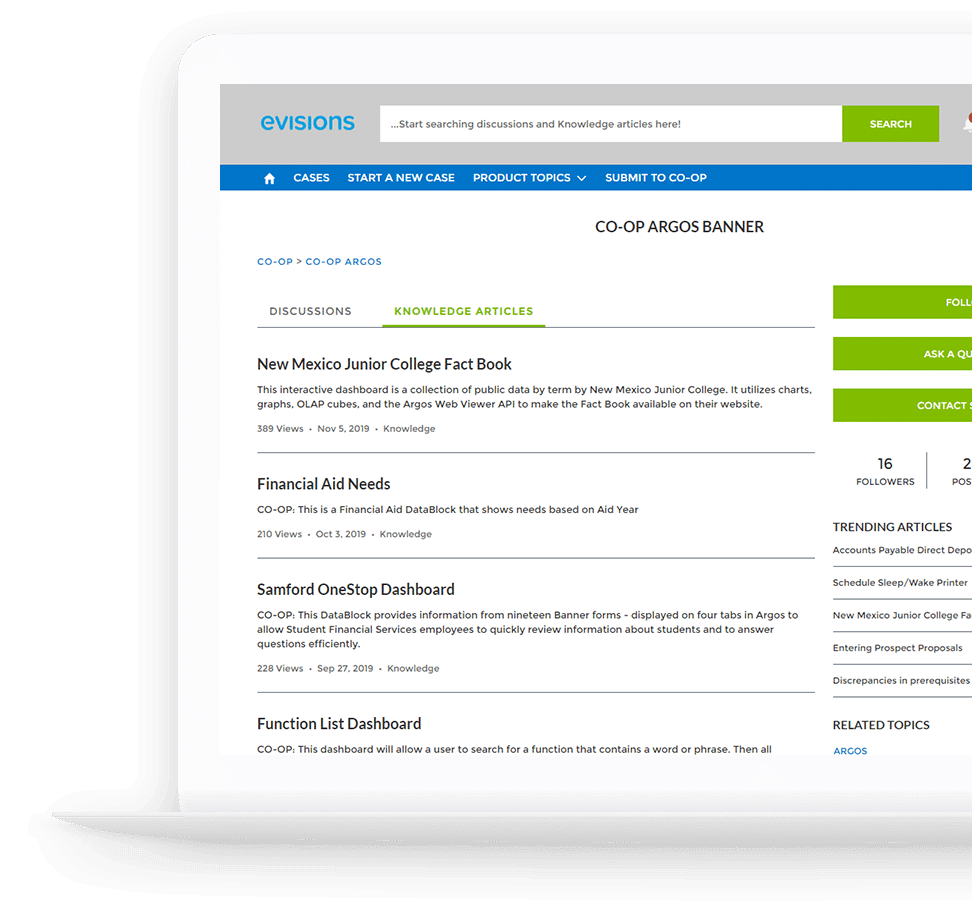
Argos’s CO-OP user community can help you speed up implementation and lower your total cost of ownership, with an online library containing pre-designed reports and DataBlocks. It encourages collaboration and sharing by bringing together higher education professionals with similar reporting responsibilities and experiences.
Add Style and Functionality with Advanced Features
Enhance your reporting capabilities with Argos’ Advanced Features, which can improve the look, flexibility, accessibility, and delivery of your reports.
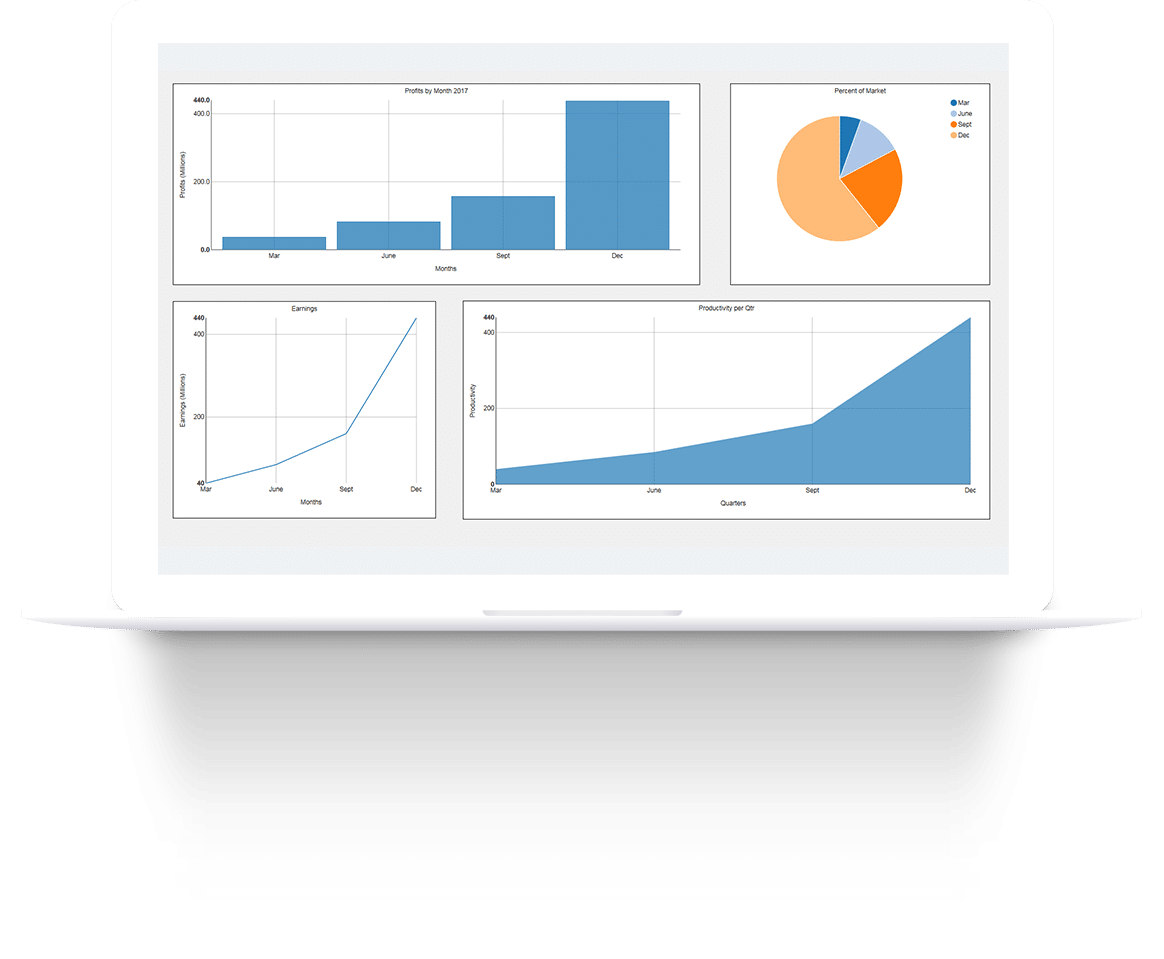
Interactive Charts & Dynamic Real-Time Dashboards
Centralize Your Inbound & Outbound Data
Fast and Flexible OLAP Data Cubes
Seamless Integration with Other Applications
What Type Of User Are You?
Report Viewer
Run fully formatted reports, dashboards, OLAP cubes, and charts without having to rely on other departments. Our Report Viewer gives you full control over export options, including: PDF; Excel; RTF; HTML; and TXT formats.

DataBlock Designer
Build sections of data, called “DataBlocks,” useful for displaying statistics in reports. A simple interface assists with parameter form creation and query display. As an added bonus, our SQL Builder helps novice users generate complex queries with ease.

Report Writer

Administrator
CHECK OUT EVISIONS CADMUS
Success Stories
Real-Time Reporting with Evisions Argos
Scott Messner discusses Nicolet College’s need to be able to access data anytime, anywhere, and on any device – and how real-time reporting with Evisions Argos has allowed them to fulfill that need. It empowers them to make timely, data-driven decisions. By trusting their reporting process to Argos, they are able to devote more focus and resources to other important projects and priorities.