

Navigating AI Security and Privacy in Higher Education
When a college or university considers using an AI tool, the conversation quickly turns from use cases to security and privacy. Let’s discuss how these providers handle security and compliance and what to ask before sending student data to a model. We’ll start with...
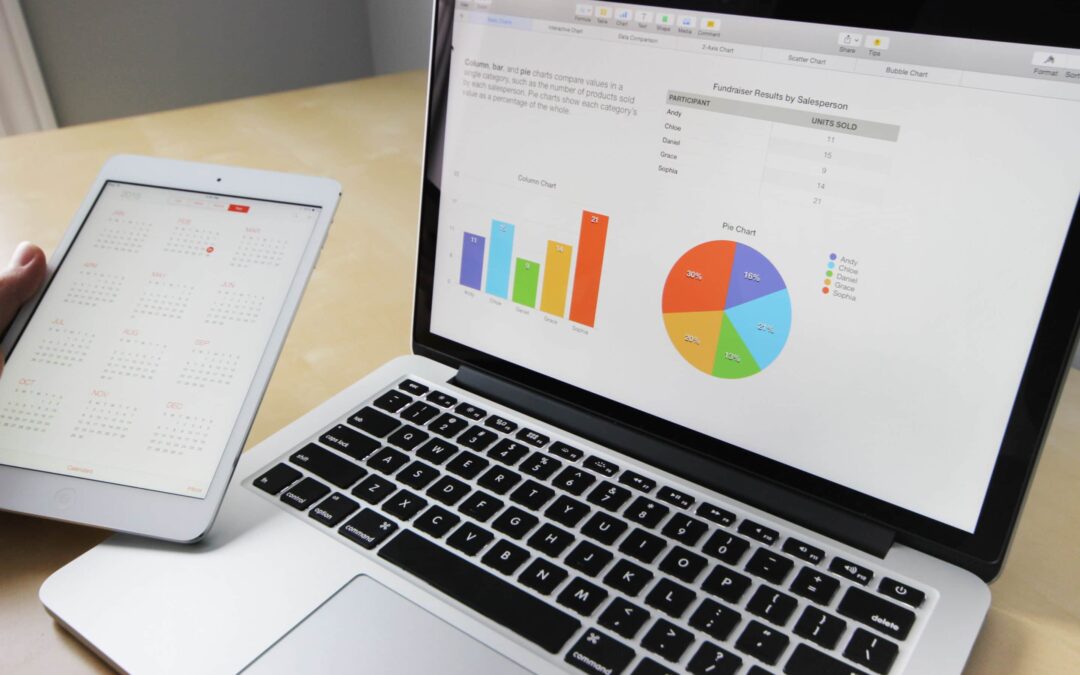
Pie Chart – Headcount by Age
The Chart This is a pie chart, useful when you want to show how a small set of categories make up a single whole. Each slice represents a non-overlapping group (age band), so you can see the composition quickly. For readability, keep the number of slices to 6–7,...
Foundations of a Campus Data Ecosystem
For more than 25 years, we’ve focused on one thing: helping colleges and universities use data and technology to move real work forward. Today we’re excited to introduce the Field Guide Series, a six-part collection of short, practical modules you can put to use right...
Stacked Area Chart – Gift Amount by Source
The Chart This is a stacked area chart, which is useful when you want to see both the total amount of a variable and the mix inside that total over time. Each band represents a source (Appeal, Donor Dinner, Event, and Other/Unknown), so you can read both volume...