The Chart
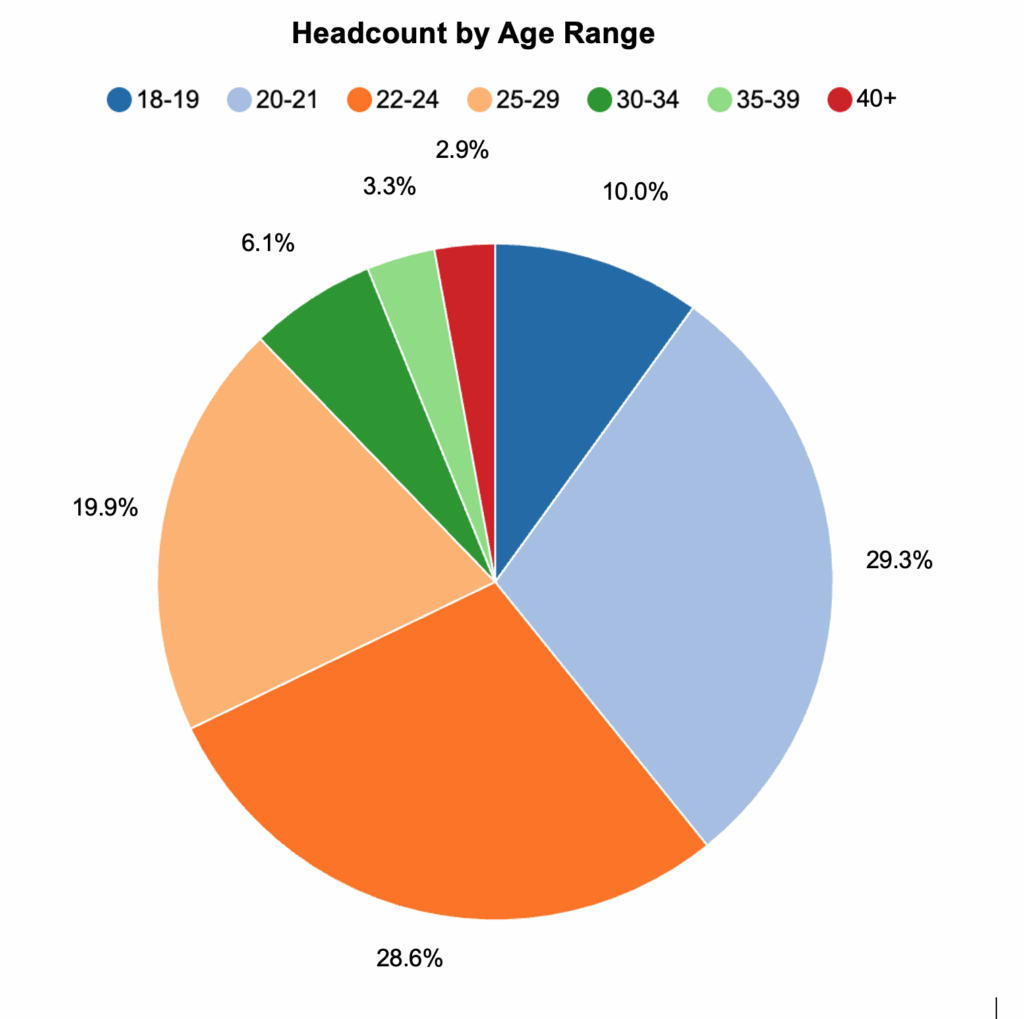
This is a pie chart, useful when you want to show how a small set of categories make up a single whole. Each slice represents a non-overlapping group (age band), so you can see the composition quickly. For readability, keep the number of slices to 6–7, label percentages directly, and use a restrained palette. Order the slices logically (youngest to oldest) and ensure bands are mutually exclusive.
What It Answers
What’s the composition of our campus by age, and should we plan services specifically for adult students?
Start by grouping the slices into 18–24 versus 25+. In this view, 18–24 is about 68%, while 25+ totals about 32%. That second share is big enough to influence scheduling, advising hours, modality options, and messaging. A common pitfall with pies is small differences between slices are hard to judge; if you need precise comparisons, switch to another chart.
Try it Yourself
You only need Student ID, date of birth (or age at census), and your census date. Calculate age at census, then bin students into agreed ranges. Filter to the same population and term so the denominator is total headcount. Count students in each band, divide by the total, and round percentages consistently. Build a pie with slices ordered by age and label percentages on or just outside the slices.


0 Comments